Morse Code Practice Key

Recently I’ve been trying to fill in some of the massive holes in my knowledge about radio. For this reason I’d quite like to have a go at the radio amateur license exams. No idea how to go about it though, the geographic complications. I suppose I might stand a chance with the Italian version, as long as I could take a dictionary with me. Anyone know anything about this?

Anyhow, even though it’s rather anachronistic (and no longer a requirement for the exams), the radio amateur sites all have some mention of Morse Code. I’ve always wanted to learn it, I guess from watching too many spy films. There are loads of things I should be doing, but yesterday’s procrastination was making this gadget. Good fun.

Hardware Delusions

The key front end sensors I wish to build for this project are an ELF/VLF radio receiver and a seismometer. The frequency ranges of interest here are < 20kHz,  in other words, in the audio range (and probably extending a little lower).

As it happens, in a past life I studied audio frequency electronics, transducers, signals and systems, DSP and so on formally for 3 years, have written articles on (nonlinear) analog electronics for a magazine, and probably more significantly have been an electronic music hobbyist for around 40 years. In short, I consider myself something of an expert in the field. The word for this is hubris.

I started planning the sensors like a bull at a gate. On the seismic side, I hadn’t really thought things through very well. On the radio side – I’d only really skimmed Radio Nature, and my knowledge of radio reception is minimal. Since then, the flaws in my ideas have poured out.

Seismic Errors

I’ve got a design for seismic signal sensors roughed out. While a magnet & coil is a more traditional way of detecting audio frequency deflections, I thought it would be neater somehow to use semiconductor Hall Effect devices. A standard design for a proximity detector is one of these components (which are housed much like transistors) backed by a magnet. When a something like a piece of iron passes by, the magnetic flux varies and hence the output of the device (linear output devices are available).

So for my seismometer, the moving part will be a steel ball bearing on a spring, hanging in a jar of oil (for damping). There will be 3 sensors located in the x, y & z directions (N-S, E-W, up-down) relative to this.

One potential complication with this setup had occurred to me. For a (relatively) linear response, the ball bearing would have to move in line with the face of the sensor. Obviously, in practice, most of the time the movement will be off-axis. However, my thinking went, there should still be enough information coming from all 3 sensors in combination to potential determine the deflection of the ball bearing. The data produced by these sensors will ultimately go into a neural network system, and they’re good at figuring out peculiar relationships.

But I’d missed another potential source of problems, it only came to me a couple of days ago. There is likely to be significant, pretty complex, interaction between the ball bearing and all 3 magnets. Whether or not this additional complication will be such that that the directional seismic information is totally obfuscated remains to be seen. I plan to experiment, maybe I’ll need 3 independent sensors…

Loopy

A little learning is a dang’rous thing. The danger I faced was wasting time & money in building a VLF receiver that simply couldn’t work.

I’d only skimmed the material, but something about the use of a coil as a receiver appealed to me. But the designs I’d seen were all pretty big, say around 1m in diameter. Hmm, thinks I, why not shrink that down to say 30cm and just boost the gain of the receiver circuit. It was only after I’d wound such a coil and picked up nothing but hum & noise that I got around to reading a little more.

It turns out there are two related issues involved: the way a small (relative to wavelength) loop antenna works isn’t exactly intuitive, and also its output is very low. It’s frequency-dependent, but the level of the desired signal is at a similar order of magnitude as the thermal noise generated by the loop, less than that of many op amps. The good Signore Romero, author of Radio Nature, has a practical discussion of this in his description of A Minimal ELF Loop Receiver. (Being at the low end of the frequency range of interest make this rather a worst-case scenario, but the points still apply). Basically there’s a good reason for having a big coil.

Another possible design flaw coming from my lack of learning is that I initially thought it would make sense to have coils in the x, y & z dimensions. As it turns out, because VLF signals are propagated as ground waves (between the surface of the planet and the ionosphere), pretty much all a coil in the horizontal plane will pick up is local noise such as mains hum. But I’m not yet discarding the inclusion of such a loop. Given the kind of neural net processing I have in mind, a signal that is comprised of little more than local noise may well be useful (in effect subtract this from the other signals).

But even having said all this, a loop antenna may still be of no use for me here – Noise Annoys. Renato has an image that nicely sums up the potential problem:

renato-noise

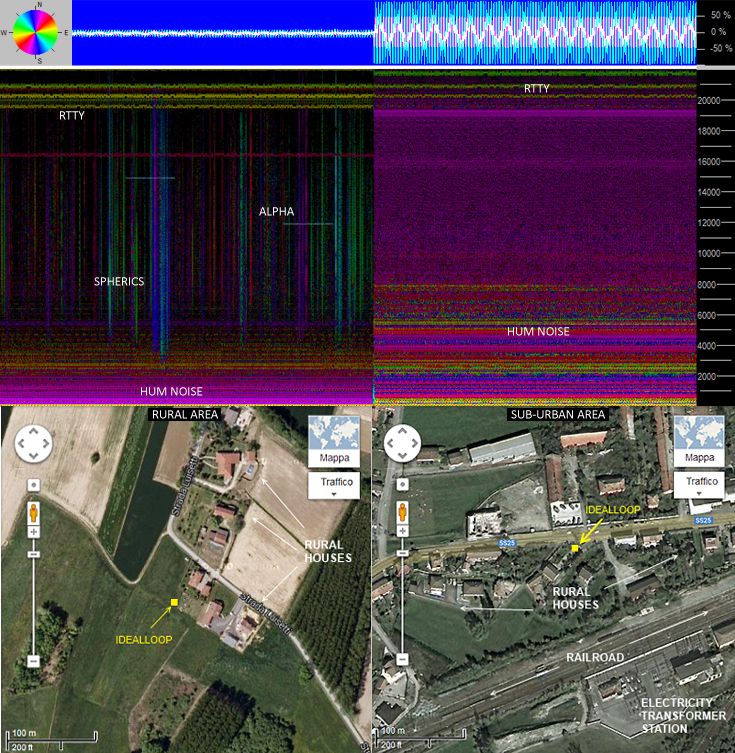
Right now I don’t have the funds to build a loop antenna of any description (big coils use a lot of wire!) but as and when I can, I’ll probably be looking at something along the lines of Renato et al’s IdealLoop (the image above comes from that page).

I do have the components to put together some kind of little portable whip antenna (electric field) receiver, I think I’ll have a look at that next, particularly to try and get an idea of how the noise levels vary in this locale.

I’ve also got one linear Hall effect sensor, so I can have a play around with that to try and get some idea of my seismometer design’s viability.


Summary for my Mother

She doesn’t have a science/technology/coding background, but asked me. But she does understand purple prose, mailed her this:

This is my view : it has been observed that many earthquakes have been preceded by unusual electrical activity in the atmosphere, and this has been made evident in the Extremely Low Frequency/Very LF radio bands.

These happen to be the frequency bands that audio works at, so a lot of existing technologies can be applied to its analysis (although the signals are radio rather than acoustic). There are plausible scientific explanations for these phenomena – if virtually any kind of rock is heavily compressed or stretched it generates electricity, at least some of which is expressed as radio waves. Rocks get squeezed and pulled before a split. Research to date has generally been inconclusive, even negative on this having potential for predicting earthquakes.

The biggest problem in my opinion is that there is a massive amount of unrelated noise in the system – things like lightning strikes are very loud in the wavebands in question, let alone solar flares. But recent developments in machine learning, aka Deep Learning, have been very good at pulling out features of interest from a very confused situation.

My hypothesis is that modern neural nets will be able to detect patterns well enough (beyond what traditional techniques can find) to provide an early warning system. Don’t get me wrong, I’m only half convinced myself, but if there’s a 10% of the idea making sense, 10% chance of it being codable (that bit’s 100%, but hypothetically) and a 10% chance of being able to exploit it, I’ll be out in the garden in a tent and will live to talk bollocks again. Or come back in shame-faced – but still alive.

Provisional Graph

I’ve now located the minimum data sources needed to start putting together the neural network for this system. I now need to consider how to sample & shape this data. To this end I’ve roughed out a graph – it’s short on details and will undoubtedly change, but should be enough to decide on how to handle the inputs.

To reiterate the aim, I want to take ELF/VLF (and historical seismic) signals and use them to predict future seismic events.

As an overall development strategy, I’m starting with a target of the simplest thing that could possibly work, and iteratively moving towards something with a better chance of working.

Data Sources

I’ve not yet had a proper look at what’s available as archived data, but I’m pretty sure what’s needed will be available.  The kind of anomalies that precede earthquakes will be relatively rare, so special case signals will be important in training the network. However, the bulk of training data and runtime data will come come from live online sources.

Seismic Data

Prior work (eg OPERA) suggests that clear radio precursors are usually only associated with fairly extreme events, and even those are only detectable using traditional means for geographically close earthquakes. The main hypothesis of this project is that Deep Learning techniques may pick up more subtle indicators, but all the same it makes sense to focus initially on more local, more significant events.

The Istituto Nazionale di Geofisica e Vulcanologia (INGV) provides heaps of data, local to Italy and worldwide. A recent event list can be found here. Of what they offer I found it easiest to code against their Atom feed which gives weekly event summaries. (No surprise I found it easiest, I had a hand in the development of RFC4287 🙂

I’ve put together some basic code for GETting and parsing this feed.

Radio Data

The go-to site for natural ELF/VLF radio information is vlf.it and it’s maintainer Renato Romero has a station located in northern Italy. The audio from this is streamed online (along with other channels) by Paul Nicholson. Reception, logging and some processing of this data is possible using Paul’s VLF Receiver Software Toolkit. I found it straightforward to get a simple spectrogram from Renato’s transmissions using these tools. I’ve not set up a script for logging yet, but I’ll probably get that done later today.

It will be desirable to visualise the VLF signal to look for interesting patterns and the best way of doing this is through spectrograms. Conveniently, this makes the problem of recognising anomalies essentially a visual recognition task – the kind of thing the Deep Learning literature is full of.

The Provisional Graph

Here we go –

provisional-nn-2017-07-03

CNN – convolutional neural network subsystem
RNN – recurrent neural network subsystem (probably LSTMs)
FCN – fully connected network (old-school backprop ANN)

This is what I’m picturing for the full training/runtime system. But I’m planning to set up pre-training sessions. Imagine RNN 3 and its connections removed. On the left will be a VLF subsystem and on the right a seismic subsystem.

Pre-Training

In this phase, data from VLF logs will be presented as a set of labeled spectrograms to a multi-layer convolutional network CNN. VLF signals contain a variety of known patterns, which include:

  • Man-made noise – the big one is 50Hz mains hum (and its harmonics), but other sources include things like industrial machinery, submarine radio transmissions.
  • Sferics – atmospherics, the radio waves caused by lightning strikes in a direct path to the receiver. These appear as a random crackle of impulses.
  • Tweeks – these again are caused by lightning strikes but the impulses are stretched out through bouncing between the earth and the ionosphere. They sound like brief high-pitched pings.
  • Whistlers – the impulse of a lightning strike can find its way into the magnetosphere and follow a path to opposite side of the planet, possibly bouncing back repeatedly. These sound like descending slide whistles.
  • Choruses – these are caused by the solar wind hitting the magnetosphere and sound like a chorus of birds or frogs.
  • Other anomalous patterns – planet Earth and it’s environs are a very complex system and there are many other sources of signals. Amongst these (it is assumed here) will be earthquake precursors caused by geoelectric activity.

Sample audio recordings of the various signals can be found at vlf.it and Natural Radio Lab. They can be quite bizarre. The key reference on these is Renato Romero’s book Radio Nature – strongly recommended to anyone with any interest in this field. It’s available in English and Italian (I got my copy from Amazon).

So…with the RNN 3 path out of the picture, it should be feasible to set up the VLF subsystem as a straightforward image classifier.

On the right hand side, the seismic section, I imagine the pre-training phase being a series of stages, at least with: seismic data->RNN 1; seismic data->RNN 1->RNN 2. If you’ve read The Unreasonable Effectiveness of Recurrent Neural Networks (better still, played with the code – I got it to write a Semantic Web “specification”) you will be aware of how good LSTMs can be at picking up patterns in series. But it’s pretty clear that the underlying system behind geological events will be a lot more complex than the rules of English grammar & syntax. But I’m (reasonably) assuming that sequences of events, ie predictable patterns do occur in geological systems. While I’m pretty certain that this alone won’t allow useful prediction with today’s technology, it should add information to the system as a whole in the form of probabilistic ‘shapes’. Work already done elsewhere would seem to bear this out (eg see A Deep Neural Network to identify foreshocks in real time).

Training & Prediction

Once the two subsystems have been pre-trained for what seems a reasonable length of time, I’ll glue them together, retaining the learnt weights. The VLF spectrograms will now be presented as a temporal sequence, and I strongly suspect the time dimension will have significance in this data, hence the insertion of extra memory in the form of RNN 3.

At this point I currently envisage training the system in real time using live data feeds.  (So the seismic sequence on the right will be time now, and the inputs on the left will be now-n). I’m not entirely sure yet how best to flip between training and predicting, worst case periodically cloning the whole system and copying weights across.

A more difficult unknown for me right now is how best to handle the latency between (assumed) precursors and events.  The precursors may appear hours, days, weeks or more before the earthquakes. While I’m working on the input sections I think I need to read up a lot more on Deep Learning & cross-correlation.

Reading online VLF

For the core of the VLF handling section of the neural nets, my current idea couldn’t be much more straightforward. Take periodic spectrograms of the signal(s) and use them as input to a CNN-based visual recognition system. There are loads of setups for these available online. The ‘labeling’ part will (somehow) come from the seismic data handling section (probably based around an RNN). This is the kind of pattern that hopefully the network will be able to recognise (the blobby bits around 5kHz):

Screenshot from 2017-07-01 18-07-52

“Spectrogramme of the signal recorded on September 10, 2003 and concerning the earthquake with magnitude 5.2 that occurred in the Tosco Emiliano Apennines, at a distance of about 270 km from the station, on September 14, 2003.” . From Nardi & Caputo, A perspective electric earthquake precursor observed in the Apennines

It’ll be a while yet before I’ll have my own VLF receiver set up, but in the meantime various VLF receiver stations have live data online, available through vlf.it. This can be listened to in a browser, e.g. Renato Romero’s feed from near Turin at http://78.46.38.217:80/vlf15 (have a listen!).

So how to receive the data and generate spectrograms? Like a fool I jumped right in without reading around enough. I wasted a lot of time taking the data over HTTP from the link above into Python and trying to get it into a usable form from there. That data is transmitted using Icecast, specifically using an Ogg Vorbis stream. But the docs are thin on the ground so decoding the stream became an issue. It appears that an Ogg header is sent once, then a continuous stream. But there I got stuck, couldn’t make sense of the encoding, leading me to look back at the docs around how the transmission was done. Ouch! I really had made a rod for my own back.

Reading around Paul Nicholson’s pages on the server setup, it turns out that the data is much more readily available with the aid of Paul’s VLF Receiver Software Toolkit. This is a bunch of Unixy modules. I’ve still a way to go in putting together suitable shell scripts, definitely not my forte. But it shouldn’t be too difficult, within half an hour I was able to get the following image:

img

First I installed vlfrx-tools, (a straightforward source configure/make install, though note that in latest Ubuntu in the prerequisites it’s libpng-dev not libpng12-dev). Then ran the following:

vtvorbis -dn 78.46.38.217,4415 @vlf15

– this takes Renato’s stream and decodes it into buffer @vlf15.

With that running, in another terminal ran:

vtcat -E30 @vlf15 | vtsgram -p200 -b300 -s '-z60 -Z-30' > img.png

– which pulls out 30 seconds from the buffer and pipes it to a script wrapping the Sox audio utility to generate the spectrogram.