Kodaly Music Hand Signals

PS. I did a rough video on this.

You should probably visit the ‘Tutor’ (data capture application) to get an idea of what I’m talking about before reading on.

This mini-project is a tangent to the ELFQuake project proper, to help familiarize myself with machine learning techniques & tools.
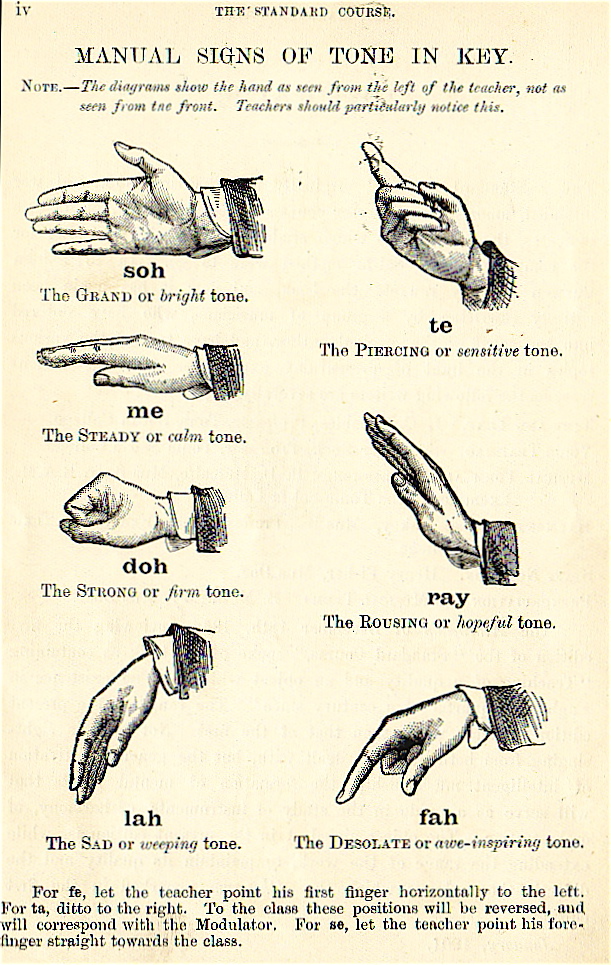
Curwen/Kodaly Hand Signals

After this occurred to me last week, I’ve made some progress in implementation. But first some background.

Solfège Hand Signs

Solfège, Curwen, or Kodaly hands signs are a system of hand symbols representing the different pitches in a tonal scale. They’re used to provide a physical association of a pitch system to help connect inner hearing and reading of pitches with musical performance.

from What Is The Purpose Of Solfege Hand Signs?

In their basic form, these are 7 hand signals that are associated with the notes of Tonic sol-fa notation : do, re, mi, fa, sol, la, ti

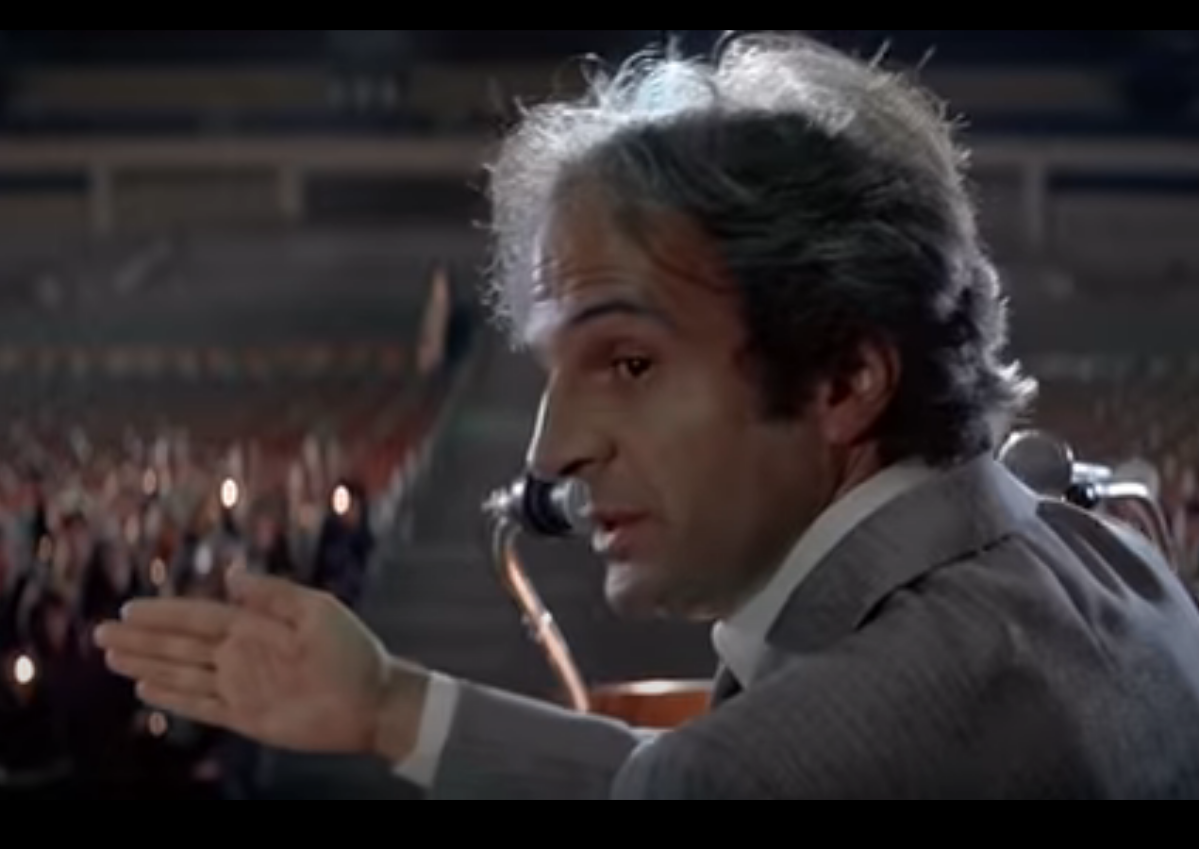
They made an appearance in the wonderful 1977 film Close Encounters of the Third Kind :

For the musically inclined among you, only having 7 tones may seem a bit limited – even Close Encounter’s tune uses the do at an octave. I believe Kodaly’s extension of Curwen’s system allows a greater range by holding the sign higher or lower (I think – need to google some more). Also the semitones in between are covered. The diagram above mentions fe, ta, and se, whatever they might be. But for now 7 tones feels like plenty.

The Aim

To build a system capable of recognizing Solfège hand signals and playing appropriate tones.

This has been done before – MiLa: An Audiovisual Instrument for Learning the Curwen Hand Signs – but that system used specialized motion capture hardware. Here the plan is to use a regular webcam.

Right now I’m only thinking of getting to a proof of concept, though given that I’ve got an ESP32-Cam module sitting on my shelf, and TensorFlow Lite Micro is supported, there’s potential for embedded fun further down the line.

The Plan

  1. Acquire a lot of images of the hand signals (with associated labels)
  2. Train a machine learning system with that data
  3. Use the trained model to take hand signal images from a webcam and generate the corresponding tones, in real time

Let me unwrap that, starting with 2.

MNIST

The MNIST database of handwritten digits is commonly used as a benchmark for testing pattern recognition/machine learning algorithms. It comprises a total of 70,000 images with associated labels (0-9), which looks something like this –
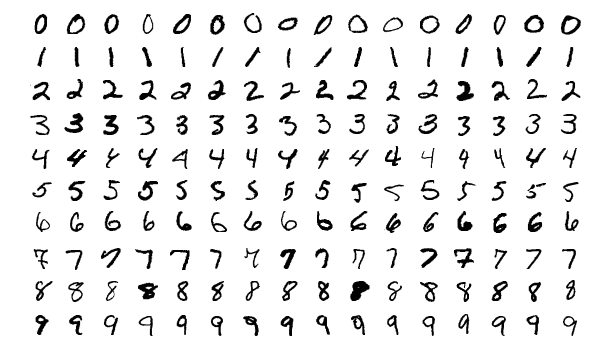
Typically you take the training set of 60,000 images, fire them (and their labels) at your learning system for as long as it takes. Then you use the test set of 10,000 images (and labels) to evaluate how good your system is at recognising previously unseen images.

This is isomorphic to the core of what is required to recognize hand signals.

There are a lot of systems coded up to work on MNIST. It’s hard not to see a competitive element where different algorithms are proposed that push the accuracy up a little bit further. Wikipedia lists a bunch of classifiers, with error rate ranging from 7.6% (Pairwise linear classifier) to 0.17% (Committee of 20 CNNS with Squeeze-and-Excitation Networks [?!]).

Where the code is available, it’s typically set up to allow reproduction of the results. You point say train.py at the MNIST image and label training set files, wait potentially a very long time, then point test.py at the test set files, then hopefully soon after some numbers pop out giving the accuracy etc.

While the MNIST database is ubiquitous, various limitations have been pointed out. The elephant in the room is that the fact that a particular system does exceedingly well on MNIST doesn’t mean it’ll be good for any other kind of images. This and other issues were the motivation for Fashion-MNIST, a database of more complex images.

I have absolutely no idea what kind of system topology will work well with the hand signals, they are qualitatively a lot different than handwritten digits. But, if I format my dataset as a drop-in replacement for MNIST, I can pick a wide variety of setups off the shelf and try them out, with no extra coding required (this is also the approach taken with Fashion-MNIST). Parameter tweaking will no doubt be needed, but simple trial & error should cover enough bases.

The MNIST format does look rather arcane, but it shouldn’t take me too long to figure a script to compose the data this way.

Back to the Plan part 1.

Data Acquisition

MNIST has 70,000 images. Even if I could capture one a second, this would still take about 20 hours. Noooo..!

But I’m only aiming for a proof of concept, I will consider that achieved with something like a 90% success rate. Almost ever paper you see featuring machine learning will have a chart somewhere with a curve that starts steep and quickly levels off, becoming virtually flat a little way below some desired goal.

I think it’s reasonable to assume most of the systems that can operate on MNIST-like data will have this characteristic, with size of training dataset on the horizontal axis and accuracy on the vertical.

How many sample images will be needed to get to 90%? Clearly it will depend on the algorithms, but in the general case I have no idea. Lots.

So I need to be able to capture images quickly.

After a bit of futile play trying to get a Python GUI app going I gave up (curse you Wayland!), decided to try Javascript in the browser instead. Which, after what experts might consider excessive time on StackOverflow and not enough on MDN API docs,

I got running as a single-page application.

The capture of images from the webcam was straightforward via a <video> element (although there is an outstanding issue in that I couldn’t get the camera light to go off).

Processing, via <canvas> elements turned out to be a lot more convoluted than I expected, I didn’t find that intuitive at all. ‘hidden‘ is the keyword.

Similarly, it took me a good while to figure out a quick way of saving the final image to file (by addressing a hidden <a> element programmatically).

I started with mouse input on <button> elements but soon realised (as any fule kno) that for speed it had to be the keyboard. But that and the rest was pretty straightforward. Generating the tones was trivial, although my code might not be as considerate to the host as it could be.

A huge advantage of implementing this in a browser (aside from being able to get it to work) is the potential for crowdsourced data acquisition. I’ll tweet this!

It was pretty much an afterthought to try this on a mobile device. When I first tried it on my (Android) phone, Capture didn’t work. It is quite possible I had the camera open elsewhere, but I’m still confused why I could see the video stream. Today I showed it to Marinella on her phone, expecting Capture to fail there too. It worked! I just tried again on mine (making sure camera was off), it worked there too!

Even if it does basically work on mobile, there’s still a snag. Ok, from the desktop I can ask people to zip up a bunch of images and mail them to me or whatever. Doing things like that on a mobile device is a nightmare.

If anyone says their willing to capture a bunch of images, but it’ll have to be on mobile, I’m sure I can set something up to quickly post individual images from the application up to a server.

Onto Plan part 3.

Runtime Application

You make a hand signal to a camera, which is periodically taking snapshots. If a snapshot is recognised with reasonable certainty as being of a hand signal, the corresponding tone is played.

Implementation is very much To Be Decided, I’ve got all the data conversion & model play to do first.

Because the ML code will be built with Python, my original thought was to go with this for an application, like a little desktop GUI. I’ve since gone off this idea (blast your eyes, Wayland!). I sometimes forget that I’m a Web person.

So provisionally I’m thinking I’ll set it up as a service over HTTP. Aaron’s web.py is a fun thing I’ve not played with for a long time.
Preconditioning Seismic Data

The filtered data I have is CSV with lots of lines with the fields :

datetime, latitude, longitude, depth, magnitude

The latter 4 fields will slot in as they are, but a characteristic of seismic events is that they can occur at any time. Say today 4 events were detected at the following times:

E1 01:15:07 lat1 long1 d1 2.2
E2 01:18:06 lat2 long2 d2 3.1
E3 01:20:05 lat3 long3 d3 2.1
E4 08:15:04 lat4 long4 d4 3.5

To get the data in a shape that can act as input to a neural network (my first candidate is PredNet), it seems like there are two main options:

Time Windows

Say we decide on a 6 hour window starting at 00:00. Then E1, E2, E3 will fall in one window, E4 the next.  Which leads to the question of how to aggregate the first 3 events. Often events are geographically clustered, a large event will be associated with nearby foreshocks and aftershocks. For a first stab at this, it doesn’t seem unreasonable to assume such clustering will be the typical case. With this assumption, the data collapses down to :

[00:00-06:00] E2 lat2 long2 d2 3.1
[06:00-12:00] E4 lat4 long4 d4 3.5

This is lossy, so if say E1 and E2 were in totally different locations, the potentially useful information of E1 would be lost. A more sophisticated strategy would be to look for local clustering – not difficult in itself (check Euclidian distances), but then the question would be how to squeeze several event clusters into one time slot. As it stands it’s a simple strategy, and worth a try I reckon.

Time Differences

This strategy would involve a little transformation, like so:

E1[datetime]-E0[datetime] = ? lat1 long1 d1 2.2
E2[datetime]-E1[datetime] = 00:03:01 lat2 long2 d2 3.1
E3[datetime]-E2[datetime] = 00:02:01 lat3 long3 d3 2.1
E4[datetime]-E3[datetime] = 07:05:01 lat4 long4 d4 3.5

Now I must confess I really don’t know how much sense this makes, but it is capturing all the information, so it might just work. Again, it’s pretty simple and also worth a try.

I’d very much welcome comments and suggestions on this – do these strategies make sense? Are there any others that might be worth a try?


Candidate Neural Network Architecture : PredNet

While I sketched out a provisional idea of how I reckoned the network could look, I’m doing what I can to avoid reinventing the wheel. As it happens there’s a Deep Learning problem with implemented solutions that I believe is close enough to the earthquake prediction problem to make a good starting point : predicting the next frame(s) in a video. You train the network on a load of sample video data, then at runtime give it a short sequence and let it figure out what happens next.

This may seem a bit random, but I think I have good justification. The kind of videos people have been working with are things like human movement or motion of a car. (Well, I’ve seen one notable, fun, exception : Adversarial Video Generation is applied to the activities of Mrs. Pac-Man). In other words, a projection of objects obeying what is essentially Newtonian physics. Presumably seismic events follow the same kind of model. As mention in my last post, I’m currently planning on using online data that places seismic events on a map – providing the following: event time, latitude, longitude, depth and magnitude. The video prediction nets generally operate over time on x, y with R, G, B for colour. Quite a similar shape of data.

So I had a little trawl of what was out there.  There are a surprisingly wide variety of strategies, but one in particular caught my eye : PredNet. This is described in the paper Deep Predictive Coding Networks for Video Prediction and Unsupervised Learning (William Lotter, Gabriel Kreiman & David Cox from Harvard) and has supporting code etc. on GitHub. Several things about it appealed to me. It’s quite an elegant conceptual structure, which translates in practice into a mix of convnets/RNNs, not too far from what I anticipated needing for this application. This (from the paper) might give you an idea:

prednet-block

Another plus from my point of view was that the demo code is written using Keras on Tensorflow, exactly what I was intending to use.

Yesterday I had a go at getting it running.  Right away I hit a snag: I’ve got this laptop set up for Tensorflow etc. on Python 3, but the code uses hickle.py, which uses Python 2. I didn’t want to risk messing up my current setup (took ages to get working) so had a go at setting up a Docker container – Tensorflow has an image. Day-long story short, something wasn’t quite right. I suspect the issues I had related to nvidia-docker, needed to run on GPUs.

Earlier today I decided to have a look at what would be needed to get the PredNet code Python3-friendly. Running kitti-train.py (Kitti is the demo data set) led straight to an error in hickle.py. Nothing to lose, had a look. “Hickle is a HDF5 based clone of Pickle, with a twist. Instead of serializing to a pickle file, Hickle dumps to a HDF5 file.“. There is a note saying there’s Python3 support in progress, but the cause of the error turned out to be –

if isinstance(f, file):

file isn’t a thing in Python3. But kitti-train.py was only passing a filename to this, via data-utils.py, so I just commented out the lines associated with the isinstance. (I guess I should fix it properly, feed back to Hickle’s developer.)

It worked! Well, at least for kitti-train.py. I’ve got it running in the background as I type. This laptop only has a very wimpy GPU (GeForce 920M) and it took a couple of tweaks to prevent near-immediate out of memory errors:

export TF_CUDNN_WORKSPACE_LIMIT_IN_MB=100

kitty_train.py, line 35
batch_size = 2 #was 4

It’s taken about an hour to get to epoch 2/150, but I did renice Python way down so I could get on with other things.

Seismic Data

I’ve also spent a couple of hours on the (seismic) data-collecting code. I’d foolishly started coding around this using Javascript/node, simply because it was the last language I’d done anything similar with. I’ve got very close to having it gather & filter blocks of from the INGV service and dump to (csv) file. But I reckon I’ll just ditch that and recode it in Python, so I can dump to HDF5 directly – it does seem a popular format around the Deep Learning community.

Radio Data

Yes, that to think about too.

My gut feeling is that applying Deep Learning to the seismic data alone is likely to be somewhat useful for predictions. From what I’ve read, the current approaches being taken (in Italy at least) are effectively along these lines, leaning towards traditional statistical techniques. No doubt some folks are applying Deep Learning to the problem. But I’m hoping that bringing in radio precursors will make a major difference in prediction accuracy.

So far I have in mind generating spectrograms from the VLF/ELF signals. Which gives a series of images…sound familiar? However, I suspect that there won’t be quantitatively all that much information coming from this source (though qualitatively, I’m assuming vital).  As a provisional plan I’m thinking of pushing it through a few convnet/pooling layers to get the dimensionality way down, then adding that data as another input to the  PredNet.

Epoch 3/150 – woo-hoo!

PS.

It was taking way too long for my patience, so I changed the parameters a bit more:

nb_epoch = 50 # was 150
batch_size = 2 # was 4
samples_per_epoch = 250 # was 500
N_seq_val = 100 # number of sequences to use for validation

It took ~20 hours to train. For kitti_evaluate.py, it has produced some results, but also exited with an error code. Am a bit too tired to look into it now, but am very pleased to get a bunch of these:


Provisional Graph

I’ve now located the minimum data sources needed to start putting together the neural network for this system. I now need to consider how to sample & shape this data. To this end I’ve roughed out a graph – it’s short on details and will undoubtedly change, but should be enough to decide on how to handle the inputs.

To reiterate the aim, I want to take ELF/VLF (and historical seismic) signals and use them to predict future seismic events.

As an overall development strategy, I’m starting with a target of the simplest thing that could possibly work, and iteratively moving towards something with a better chance of working.

Data Sources

I’ve not yet had a proper look at what’s available as archived data, but I’m pretty sure what’s needed will be available.  The kind of anomalies that precede earthquakes will be relatively rare, so special case signals will be important in training the network. However, the bulk of training data and runtime data will come come from live online sources.

Seismic Data

Prior work (eg OPERA) suggests that clear radio precursors are usually only associated with fairly extreme events, and even those are only detectable using traditional means for geographically close earthquakes. The main hypothesis of this project is that Deep Learning techniques may pick up more subtle indicators, but all the same it makes sense to focus initially on more local, more significant events.

The Istituto Nazionale di Geofisica e Vulcanologia (INGV) provides heaps of data, local to Italy and worldwide. A recent event list can be found here. Of what they offer I found it easiest to code against their Atom feed which gives weekly event summaries. (No surprise I found it easiest, I had a hand in the development of RFC4287 🙂

I’ve put together some basic code for GETting and parsing this feed.

Radio Data

The go-to site for natural ELF/VLF radio information is vlf.it and it’s maintainer Renato Romero has a station located in northern Italy. The audio from this is streamed online (along with other channels) by Paul Nicholson. Reception, logging and some processing of this data is possible using Paul’s VLF Receiver Software Toolkit. I found it straightforward to get a simple spectrogram from Renato’s transmissions using these tools. I’ve not set up a script for logging yet, but I’ll probably get that done later today.

It will be desirable to visualise the VLF signal to look for interesting patterns and the best way of doing this is through spectrograms. Conveniently, this makes the problem of recognising anomalies essentially a visual recognition task – the kind of thing the Deep Learning literature is full of.

The Provisional Graph

Here we go –

provisional-nn-2017-07-03

CNN – convolutional neural network subsystem
RNN – recurrent neural network subsystem (probably LSTMs)
FCN – fully connected network (old-school backprop ANN)

This is what I’m picturing for the full training/runtime system. But I’m planning to set up pre-training sessions. Imagine RNN 3 and its connections removed. On the left will be a VLF subsystem and on the right a seismic subsystem.

Pre-Training

In this phase, data from VLF logs will be presented as a set of labeled spectrograms to a multi-layer convolutional network CNN. VLF signals contain a variety of known patterns, which include:

  • Man-made noise – the big one is 50Hz mains hum (and its harmonics), but other sources include things like industrial machinery, submarine radio transmissions.
  • Sferics – atmospherics, the radio waves caused by lightning strikes in a direct path to the receiver. These appear as a random crackle of impulses.
  • Tweeks – these again are caused by lightning strikes but the impulses are stretched out through bouncing between the earth and the ionosphere. They sound like brief high-pitched pings.
  • Whistlers – the impulse of a lightning strike can find its way into the magnetosphere and follow a path to opposite side of the planet, possibly bouncing back repeatedly. These sound like descending slide whistles.
  • Choruses – these are caused by the solar wind hitting the magnetosphere and sound like a chorus of birds or frogs.
  • Other anomalous patterns – planet Earth and it’s environs are a very complex system and there are many other sources of signals. Amongst these (it is assumed here) will be earthquake precursors caused by geoelectric activity.

Sample audio recordings of the various signals can be found at vlf.it and Natural Radio Lab. They can be quite bizarre. The key reference on these is Renato Romero’s book Radio Nature – strongly recommended to anyone with any interest in this field. It’s available in English and Italian (I got my copy from Amazon).

So…with the RNN 3 path out of the picture, it should be feasible to set up the VLF subsystem as a straightforward image classifier.

On the right hand side, the seismic section, I imagine the pre-training phase being a series of stages, at least with: seismic data->RNN 1; seismic data->RNN 1->RNN 2. If you’ve read The Unreasonable Effectiveness of Recurrent Neural Networks (better still, played with the code – I got it to write a Semantic Web “specification”) you will be aware of how good LSTMs can be at picking up patterns in series. But it’s pretty clear that the underlying system behind geological events will be a lot more complex than the rules of English grammar & syntax. But I’m (reasonably) assuming that sequences of events, ie predictable patterns do occur in geological systems. While I’m pretty certain that this alone won’t allow useful prediction with today’s technology, it should add information to the system as a whole in the form of probabilistic ‘shapes’. Work already done elsewhere would seem to bear this out (eg see A Deep Neural Network to identify foreshocks in real time).

Training & Prediction

Once the two subsystems have been pre-trained for what seems a reasonable length of time, I’ll glue them together, retaining the learnt weights. The VLF spectrograms will now be presented as a temporal sequence, and I strongly suspect the time dimension will have significance in this data, hence the insertion of extra memory in the form of RNN 3.

At this point I currently envisage training the system in real time using live data feeds.  (So the seismic sequence on the right will be time now, and the inputs on the left will be now-n). I’m not entirely sure yet how best to flip between training and predicting, worst case periodically cloning the whole system and copying weights across.

A more difficult unknown for me right now is how best to handle the latency between (assumed) precursors and events.  The precursors may appear hours, days, weeks or more before the earthquakes. While I’m working on the input sections I think I need to read up a lot more on Deep Learning & cross-correlation.

Reading online VLF

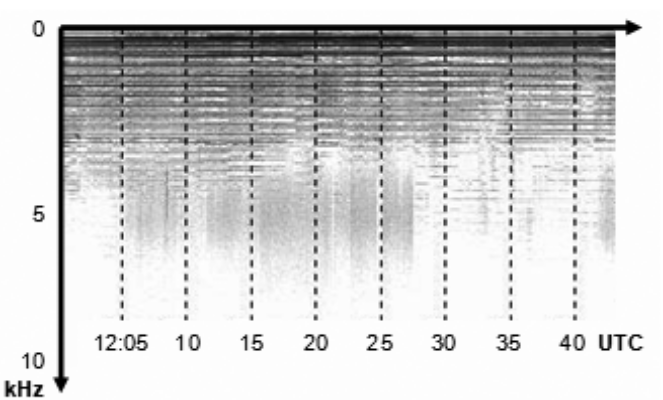
For the core of the VLF handling section of the neural nets, my current idea couldn’t be much more straightforward. Take periodic spectrograms of the signal(s) and use them as input to a CNN-based visual recognition system. There are loads of setups for these available online. The ‘labeling’ part will (somehow) come from the seismic data handling section (probably based around an RNN). This is the kind of pattern that hopefully the network will be able to recognise (the blobby bits around 5kHz):

Screenshot from 2017-07-01 18-07-52

“Spectrogramme of the signal recorded on September 10, 2003 and concerning the earthquake with magnitude 5.2 that occurred in the Tosco Emiliano Apennines, at a distance of about 270 km from the station, on September 14, 2003.” . From Nardi & Caputo, A perspective electric earthquake precursor observed in the Apennines

It’ll be a while yet before I’ll have my own VLF receiver set up, but in the meantime various VLF receiver stations have live data online, available through vlf.it. This can be listened to in a browser, e.g. Renato Romero’s feed from near Turin at http://78.46.38.217:80/vlf15 (have a listen!).

So how to receive the data and generate spectrograms? Like a fool I jumped right in without reading around enough. I wasted a lot of time taking the data over HTTP from the link above into Python and trying to get it into a usable form from there. That data is transmitted using Icecast, specifically using an Ogg Vorbis stream. But the docs are thin on the ground so decoding the stream became an issue. It appears that an Ogg header is sent once, then a continuous stream. But there I got stuck, couldn’t make sense of the encoding, leading me to look back at the docs around how the transmission was done. Ouch! I really had made a rod for my own back.

Reading around Paul Nicholson’s pages on the server setup, it turns out that the data is much more readily available with the aid of Paul’s VLF Receiver Software Toolkit. This is a bunch of Unixy modules. I’ve still a way to go in putting together suitable shell scripts, definitely not my forte. But it shouldn’t be too difficult, within half an hour I was able to get the following image:

img

First I installed vlfrx-tools, (a straightforward source configure/make install, though note that in latest Ubuntu in the prerequisites it’s libpng-dev not libpng12-dev). Then ran the following:

vtvorbis -dn 78.46.38.217,4415 @vlf15

– this takes Renato’s stream and decodes it into buffer @vlf15.

With that running, in another terminal ran:

vtcat -E30 @vlf15 | vtsgram -p200 -b300 -s '-z60 -Z-30' > img.png

– which pulls out 30 seconds from the buffer and pipes it to a script wrapping the Sox audio utility to generate the spectrogram.


Progress (of sorts)

[work in progress 2017-04-15 – material was getting long so splitting off to separate pages]

General Status

In the last month or so I’ve done a little hardware experimentation on the radio side of things, along with quite a lot of research all around the subjects. I also had a small setback. About 3 months ago I ordered a pile of components, they never arrived, a screw-up by the distributor (I wasn’t charged). Unfortunately I don’t have the funds right now to re-order things, so although I do have the resources for some limited experimentation, I can’t go full speed on the hardware. (Once I’ve got a little further along, I reckon I’ll add a ‘Donate’ button to this site – worth a try!)

This might be a blessing in disguise. Being constrained in what I can do has forced me to re-evaluate the plans. In short, in the near future I’m going to have to rely mostly on existing online data sources and simplify wherever possible. This is really following the motto of Keep It Simple, Stupid, something I should maybe have been considering from the start.


Next Steps