Kodaly Music Hand Signals

PS. I did a rough video on this.

You should probably visit the ‘Tutor’ (data capture application) to get an idea of what I’m talking about before reading on.

This mini-project is a tangent to the ELFQuake project proper, to help familiarize myself with machine learning techniques & tools.

Curwen/Kodaly Hand Signals

After this occurred to me last week, I’ve made some progress in implementation. But first some background.

Solfège Hand Signs

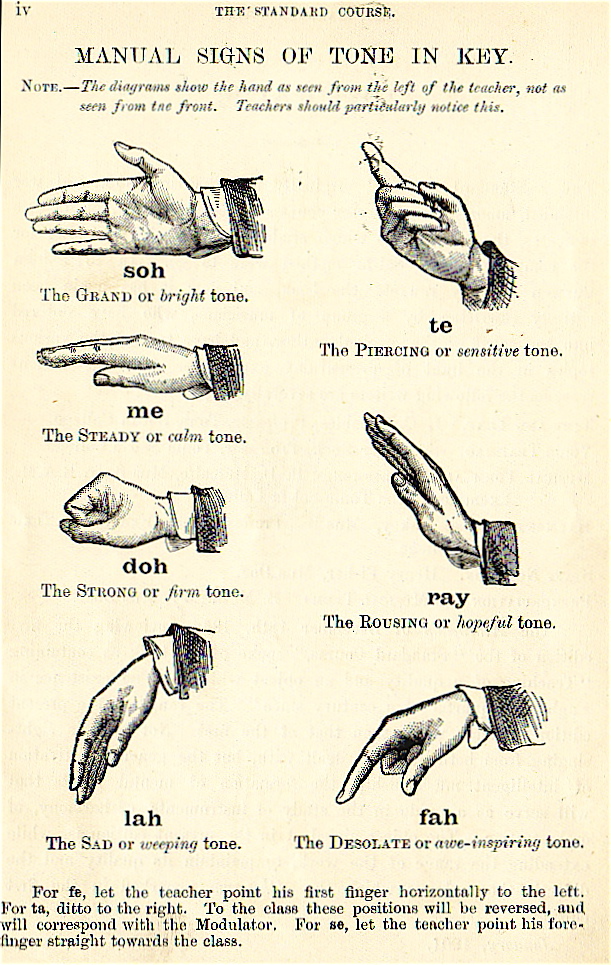
Solfège, Curwen, or Kodaly hands signs are a system of hand symbols representing the different pitches in a tonal scale. They’re used to provide a physical association of a pitch system to help connect inner hearing and reading of pitches with musical performance.

from What Is The Purpose Of Solfege Hand Signs?

In their basic form, these are 7 hand signals that are associated with the notes of Tonic sol-fa notation : do, re, mi, fa, sol, la, ti

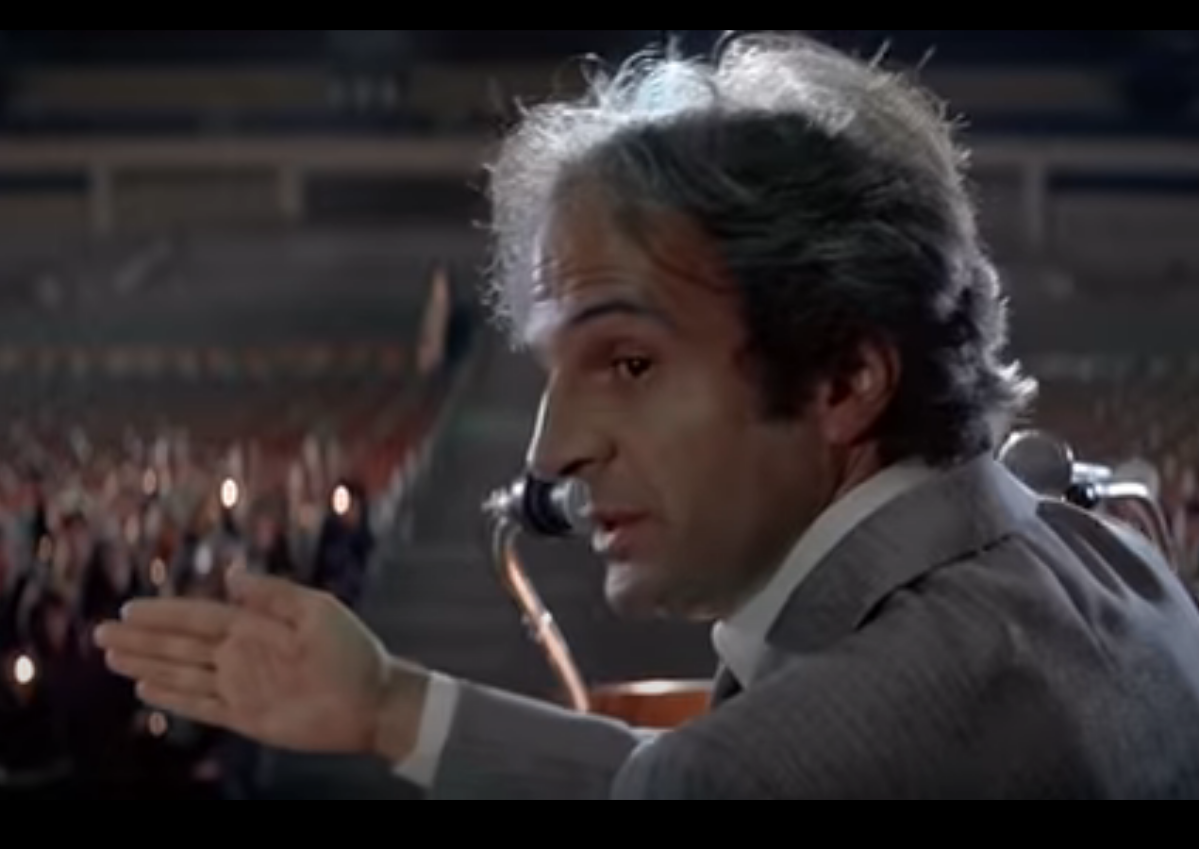
They made an appearance in the wonderful 1977 film Close Encounters of the Third Kind :

For the musically inclined among you, only having 7 tones may seem a bit limited – even Close Encounter’s tune uses the do at an octave. I believe Kodaly’s extension of Curwen’s system allows a greater range by holding the sign higher or lower (I think – need to google some more). Also the semitones in between are covered. The diagram above mentions fe, ta, and se, whatever they might be. But for now 7 tones feels like plenty.

The Aim

To build a system capable of recognizing Solfège hand signals and playing appropriate tones.

This has been done before – MiLa: An Audiovisual Instrument for Learning the Curwen Hand Signs – but that system used specialized motion capture hardware. Here the plan is to use a regular webcam.

Right now I’m only thinking of getting to a proof of concept, though given that I’ve got an ESP32-Cam module sitting on my shelf, and TensorFlow Lite Micro is supported, there’s potential for embedded fun further down the line.

The Plan

  1. Acquire a lot of images of the hand signals (with associated labels)
  2. Train a machine learning system with that data
  3. Use the trained model to take hand signal images from a webcam and generate the corresponding tones, in real time

Let me unwrap that, starting with 2.

MNIST

The MNIST database of handwritten digits is commonly used as a benchmark for testing pattern recognition/machine learning algorithms. It comprises a total of 70,000 images with associated labels (0-9), which looks something like this –

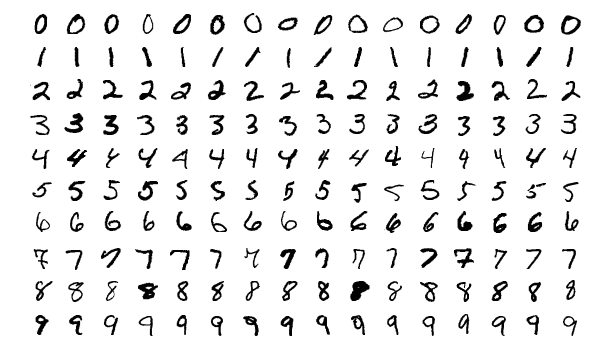
Typically you take the training set of 60,000 images, fire them (and their labels) at your learning system for as long as it takes. Then you use the test set of 10,000 images (and labels) to evaluate how good your system is at recognising previously unseen images.

This is isomorphic to the core of what is required to recognize hand signals.

There are a lot of systems coded up to work on MNIST. It’s hard not to see a competitive element where different algorithms are proposed that push the accuracy up a little bit further. Wikipedia lists a bunch of classifiers, with error rate ranging from 7.6% (Pairwise linear classifier) to 0.17% (Committee of 20 CNNS with Squeeze-and-Excitation Networks [?!]).

Where the code is available, it’s typically set up to allow reproduction of the results. You point say train.py at the MNIST image and label training set files, wait potentially a very long time, then point test.py at the test set files, then hopefully soon after some numbers pop out giving the accuracy etc.

While the MNIST database is ubiquitous, various limitations have been pointed out. The elephant in the room is that the fact that a particular system does exceedingly well on MNIST doesn’t mean it’ll be good for any other kind of images. This and other issues were the motivation for Fashion-MNIST, a database of more complex images.

I have absolutely no idea what kind of system topology will work well with the hand signals, they are qualitatively a lot different than handwritten digits. But, if I format my dataset as a drop-in replacement for MNIST, I can pick a wide variety of setups off the shelf and try them out, with no extra coding required (this is also the approach taken with Fashion-MNIST). Parameter tweaking will no doubt be needed, but simple trial & error should cover enough bases.

The MNIST format does look rather arcane, but it shouldn’t take me too long to figure a script to compose the data this way.

Back to the Plan part 1.

Data Acquisition

MNIST has 70,000 images. Even if I could capture one a second, this would still take about 20 hours. Noooo..!

But I’m only aiming for a proof of concept, I will consider that achieved with something like a 90% success rate. Almost ever paper you see featuring machine learning will have a chart somewhere with a curve that starts steep and quickly levels off, becoming virtually flat a little way below some desired goal.

I think it’s reasonable to assume most of the systems that can operate on MNIST-like data will have this characteristic, with size of training dataset on the horizontal axis and accuracy on the vertical.

How many sample images will be needed to get to 90%? Clearly it will depend on the algorithms, but in the general case I have no idea. Lots.

So I need to be able to capture images quickly.

After a bit of futile play trying to get a Python GUI app going I gave up (curse you Wayland!), decided to try Javascript in the browser instead. Which, after what experts might consider excessive time on StackOverflow and not enough on MDN API docs,

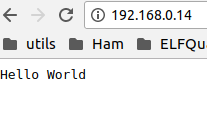
I got running as a single-page application.

The capture of images from the webcam was straightforward via a <video> element (although there is an outstanding issue in that I couldn’t get the camera light to go off).

Processing, via <canvas> elements turned out to be a lot more convoluted than I expected, I didn’t find that intuitive at all. ‘hidden‘ is the keyword.

Similarly, it took me a good while to figure out a quick way of saving the final image to file (by addressing a hidden <a> element programmatically).

I started with mouse input on <button> elements but soon realised (as any fule kno) that for speed it had to be the keyboard. But that and the rest was pretty straightforward. Generating the tones was trivial, although my code might not be as considerate to the host as it could be.

A huge advantage of implementing this in a browser (aside from being able to get it to work) is the potential for crowdsourced data acquisition. I’ll tweet this!

It was pretty much an afterthought to try this on a mobile device. When I first tried it on my (Android) phone, Capture didn’t work. It is quite possible I had the camera open elsewhere, but I’m still confused why I could see the video stream. Today I showed it to Marinella on her phone, expecting Capture to fail there too. It worked! I just tried again on mine (making sure camera was off), it worked there too!

Even if it does basically work on mobile, there’s still a snag. Ok, from the desktop I can ask people to zip up a bunch of images and mail them to me or whatever. Doing things like that on a mobile device is a nightmare.

If anyone says their willing to capture a bunch of images, but it’ll have to be on mobile, I’m sure I can set something up to quickly post individual images from the application up to a server.

Onto Plan part 3.

Runtime Application

You make a hand signal to a camera, which is periodically taking snapshots. If a snapshot is recognised with reasonable certainty as being of a hand signal, the corresponding tone is played.

Implementation is very much To Be Decided, I’ve got all the data conversion & model play to do first.

Because the ML code will be built with Python, my original thought was to go with this for an application, like a little desktop GUI. I’ve since gone off this idea (blast your eyes, Wayland!). I sometimes forget that I’m a Web person.

So provisionally I’m thinking I’ll set it up as a service over HTTP. Aaron’s web.py is a fun thing I’ve not played with for a long time.

Kaggle Earthquake Prediction Challenge

I nearly had kittens when danbri pointed this challenge out to me. I’ve thought for a long time earthquake prediction was well in scope for machine learning and have been dismayed at how little uptake there has been. (Surprised too, given the co-location of many tech people and the San Andreas fault…). Hopefully this competition will change things. Deadline is in 3 months, pretty significant $ prizes.

My second reaction was: “Great! I can work on ELFQuake and maybe win a prize!”. But that isn’t the whole picture. The competition is based around data generated in the lab, essentially by squashing a rock and recording its fractures. Apparently a reasonable approximation of geological effects.

I forget offhand where, but I’ve also seen a project aiming to use machine learning on real data. But that project, as with this competition, I feel is missing a trick. My gut says that although, sure, algorithms can almost certainly be useful in predicting seismic events, using the seismic data alone for training is a blinkered approach. These events, in the real world, occur as the result of the behaviour of a massively complex system. There are practical limitations on what can be modeled, but I’d suggest that it’s possible to creep a little further into the real world by bringing in data from other natural sources. For example, does the position of the moon influence the timing of events? Does seem at least credible, given that its gravity is enough to pull the oceans around.

The data source I reckon looks most promising is natural radio, signals that have been shown to sometimes contain artifacts associated with subsequent seismic events. This is the hypothesis of this project ELFQuake (ELF for Extremely Low Frequency, it’s in this frequency range and that of VLF, Very Low Frequency that earthquake precursors seem to occur).

For me, the Kaggle challenge has acted as a nudge, to get me moving on ELFQuake software again. What’s more, material has already appeared for the basic setup needed to process this data – data that has a lot in common with the ELFQuake targets. This is very convenient for me, as although I’m now getting somewhat familiar with the principles and algorithms of Deep Learning, my practical experience is virtually non-existent. So I’ve been given a great foot-up. Here’s some material using sklearn : video, github. The toolkit that seems to me the most appealing option  is Keras on TensorFlow (on Anaconda), but a lot of the pre/post Python wrangling will be the same.

I’ve put my name down for the competition, it’s a bit of extra motivation – potential $$$s! – to work on this stuff, and also what I get together for it can be used as a placeholder in the end-to-end system I’m aiming for (seismic & radio sensors -> data acquisition -> [magic] -> Twitter notifications).

Connecting all the World’s Circuits

I’ve been a bit frustrated in recent weeks by electronic circuit design tools. The typical process is to draw out the circuit schematic, run simulations and then generate/draw PCB layouts etc. Many of the tools (especially on *nix) use SPICE format to represent the circuit topology between the different operations.

The tools I’ve looked at so far all appear to have one major flaw or another.

To give just three examples:

  • gEDA – rather out-of-date, clunky UI
  • KiCad – the netlists it generates aren’t quite compatible with SPICE (circuit emulation) tools
  • Fritzing – the netlists it generate are nothing like SPICE format (I believe it uses XML)

So, the go-to representation as far as I’m concerned for pretty much anything is the Resource Description Framework (RDF). So I had a quick search around looking to see if anyone had looked at SPICE in RDF before. D’oh! I found a SPICE vocab I’d roughed out on GitHub around 2011. Jeez, my memory.

So it turns out that most of what I might have put in this post, I’ve already written up in Adding SPICE to the Semantic Web.

Just a couple of things to add here.

Why not use JSON? 

Since I did that post, JSON has become fairly ubiquitous, I’m sure it’s now most coders’ go-to representation of data. But in its basic form it isn’t Web-friendly, in the sense that it doesn’t natively support links.

Links could make things much easier to share and find: circuits, components, datasheets etc (the description of the circuit in RDF would include URLs for the components, which in turn could be associate with their characteristics, with their datasheets, etc etc).

There’s even a commercial angle. Given the list of components, a bill of materials can be generated. But typically nowadays you have to trawl through vendors to find suitable suppliers. But in RDF, the component could be associated with a vendor, with fields like the price etc. A distributed SPARQL query could figure much of this stuff out automatically.

Ok, why not use JSON? – There’s JSON-LD, which is an RDF representation, it’s JSON with links included.

One other idea. In the middle of typing this, I had a brief chat with Reto, told him what I was typing. He wondered whether there might be a role for inference (which is a good question, given the existence of RDF/OWL  reasoners). Hmmm, my immediate response was, yeah, maybe something like consistency-checking a circuit for dangling wires. But Reto made the point that OWL probably wouldn’t be the best reasoning for the job, this might be more of a SHACL use case.


ESP8266 Shiald Progress!

I’m really tired, but while trying to watch TV got to thinking about the Wifi board I’ve been playing with (described in previous post). I’d got as far as loading firmware that allowed it to speak AT codes. Couldn’t resist having a quick look at what could be done next. Luckily I went to my bookmarks first rather than looking at my notes here, because there was a page I must have bookmarked early on and forgotten about : Arduino UNO + ESP8266 ESP-12E UART WIFI Shield. It contains code for a minimal web server.

Looking at an image in this post reveals that the Shield there is there very same Shiald [sic] I have. Only problem, the author uses a USB-serial adapter to talk to it, something I don’t have. But wait – I found a way of rigging the Arduino to act as such an adapter (previous post).

I saw somewhere, and confirmed (by using a tablet to scan for WiFi networks) that the default IP address for the Shiald is rather an obscure one, off my local subnet anyway. But a bit of googling gave me the info necessary to set the IP to something else.

After fiddling a bit with the baud rate, a little blue light started flashing next to the ESP8266 chip, and it worked!

In the IDE:

Screenshot from 2018-02-07 23-07-57

In the Serial console:

Screenshot from 2018-02-07 23-11-12

Screenshot from 2018-02-07 23-11-35

And in a browser! Woo-hoo!

Screenshot from 2018-02-07 22-45-33

Here’s my tweaked version of the script:

#include <ESP8266WiFi.h>
#include <WiFiClient.h>
#include <ESP8266WebServer.h>
const char* ssid = "AllPay Danny";
const char* password = "not this";
ESP8266WebServer server(80); // HTTP server on port 80

IPAddress ip(192, 168, 0, 14); // where xx is the desired IP Address
IPAddress gateway(192, 168, 0, 1); // set gateway to match your network
IPAddress subnet(255, 255, 255, 0); // set subnet mask to match your network

void setup() {
 Serial.begin(115200); 
 WiFi.disconnect(); // Disconnect AP
 
 WiFi.config(ip, gateway, subnet);
 
 WiFi.mode(WIFI_STA); 
 WiFi.begin(ssid, password); // Connect to WIFI network
// Wait for connection
 while (WiFi.status() != WL_CONNECTED) {
 delay(500);
 Serial.println(".");
 }
 Serial.print("Connected to ");
 Serial.println(ssid);
 Serial.print("IP address: ");
 Serial.println(WiFi.localIP());
server.on("/", [](){
 server.send(200, "text/plain", "Hello World");
 });
server.begin(); // Start HTTP server
 Serial.println("HTTP server started.");
}
void loop() {
 server.handleClient();
}

The blog post goes on to Part 2 Upload code to Arduino, which I’ll try next – when I’m properly rested 🙂

PS.

Just tried this Part 2 bit, essentially comms between Shiald & Arduino. It nearly worked :

Data received: . .
Conoected to AllPay Danoy
IP address: 092.168.0.04C!⸮⸮⸮⸮ٕɁ⸮⸮

I’ve read somewhere that the Software Serial struggles at high baud rates, and this example is using 115200 so presumably that’s the problem. Bit of tweaking required.

PPS.

I flipped the baud rate in the code based on that in the blog post to 9600, and with the Arduino as serial converter uploaded the new code to the Shiald (at 115200 baud), set as NodeMCU 1.0. Uploading took a good few attempts, but finally it worked.

I also changed the Arduino part of the code to use different ports :

#include <SoftwareSerial.h>
SoftwareSerial mySerial(2, 3); // RX, TX on Arduino
void setup() {
 Serial.begin(9600);
 mySerial.begin(9600);
}
void loop() {
 if (mySerial.available()) {
 String msg = mySerial.readString();
 Serial.print("Data received: ");
 Serial.println(msg);
 }
}

The wiring I now have as :

Arduino   | Shiald

GND       - Debug GND
+5v       - Debug 5v
Digital 2 - Digital 0
Digital 3 - Digital 1

The switches on the Shiald are at (1,2,3,4) On, On, Off, Off.

And finally, the Hello World is still visible on the IP address I set. And what’s more, in the serial monitor (now set to 9600 baud) I see:

Connected to AllPay Danny
IP address: 192.168.0.14
HTTP server started.

Yay! It all works.

So…

Next

First thing I should do is pull together all the various bits from the last post and this, with relevant material from linked pages, and write it up as a from scratch to here procedure. I won’t remember, and also anyone that buys the same boards will stand a chance of getting things going.

Then I need to think about what I’m going to do on the analog/sensor side. What I can do with the hardware I’ve got is fairly limited – a key factor being the speed of the data acquisition on the Arduino. But I should have the necessary for me to build something that operates end-to-end with essentially the same topology as my target design.

Regarding code on the Arduino & Shiald, the next steps will be to :

  1. Get the data from the single Analog Input on the Shiald, buffer/filter it and expose it on a local web server. With a little analog pre-amp & filter this should be enough for a single-channel seismometer.
  2. Do the code necessary on a regular computer to access and do something with the data from the web server on the Shiald.
  3. Get the data from the 6 Analog Inputs on the Arduino, buffer/filter it, transfer it to the Shiald and again expose on a local web server. I might well try the analog bandpass filter idea mentioned in my previous post.
  4. As 2. but for the 6 channels.

A global job to put together in parallel with the above is the code necessary for self-description of the units to provide status information alongside the data. RDF and Web of Things time!

So now I’ve got fairly fun jobs to get on with on every side of this project :

  1. Sensor hardware
  2. Arduino/Shiald software
  3. Comms/post-processing software – I can get on with the Deep Learning bits using online sources, haven’t looked at that for weeks
  4. Notification system – hook the Deep Learning bit output to Twitter

I may have to get the dice out…

//// note to self

danny@lappie:/dev$ esptool.py --port ttyACM0 --baud 9600 flash_id
esptool.py v2.2.1
Connecting........_____....._____
Detecting chip type... ESP8266
Chip is ESP8266EX
Uploading stub...
Running stub...
Stub running...
Manufacturer: c8
Device: 4016
Detected flash size: 4MB
Hard resetting...

Arduino – initial experiences

skip to Arduino/WiFi bit, also Issues Raised and a Cunning Plan

Requirements & Constraints

On the hardware side of this project, I want to capture local seismic and ELF/VLF radio data. I’ve given myself two major constraints: it should be simple; it should be low cost. These constraints are somewhat conflicting. For example, on the seismic side, a simple approach would be to purchase a Raspberry Shake, an off-the-shelf device based on a Raspberry Pi and an (off-the-shelf) geophone. Unfortunately, these gadgets start at $375 USD, and that’s only for one dimension (and there may be software licensing issues). I want to capture 3D data, and want to keep the price comfortably under $100. Note that project non-constraints are absolute measurement, calibration etc. So the plan is to hack something. I’m taking rather a scattergun approach to the hardware – find as many approaches as are feasible and try them out.

Both the seismic and radio sensor subsystems have particular requirements when it comes to physical location. The seismic part should ideally be firmly attached to local bedrock; the radio part should be as far away as possible from interference – mains hum being the elephantine wasp in the room. For my own installation this will probably mean bolting the seismic part to my basement floor (which is largely on bedrock) and having the radio part as far up the fields as I can get it.

What seems the most straightforward starting point is to feed data from the sensors into a local ADC, pass this through a microcontroller into a WiFi transceiver, then pick this up on the home network. (WiFi range may well be an issue – but I’ll cross that bridge when I come to it).

The two microcontroller systems that seem most in the frame due to their relatively low cost are the aforementioned Raspberry Pi and the Arduino family. For a first pass, something Arduino-based seems the best bet – they are a lot cheaper than the Pis, and have the advantage of having multiple ADCs built in (compared to the Pi’s none – though there are straightforward add-ons).

Arduino Fun

Quite a while ago I ordered a couple of Arduino Unos and WiFi shields from Banggood, a China-based retailer of low cost stuff. My only prior experience with Arduinos was when my brother was building something MIDI-related and hit a code problem. He mailed me on the offchance and amusingly I was able to solve the problem in my reply – it was a fairly easy bit of C (I hadn’t done any other C for years, but coding is coding).

I instantly fell in love with the Arduino boards (actually a clone by GeekCreit). After very little time at all I was able to use the Arduino IDE to get some of the example code running on one of the devices. Light goes on, light goes off, light goes on… Very user friendly.

ESP8266 Nightmares

In my naivety, I assumed the WiFi shields would be as straightforward. Most probably are, but the ones I ordered have been distinctly painful so far. But I can at least put slow progress so far down as a learning experience. Essentially the ones I got have several issues. The story so far:

The boards I got are labeled “Arduino ESP8266 WiFi Shiald Version 1.0 by WangTongze”. Yup, that’s ‘Shiald’, not auspicious. The first major issue was that the only official documentation was in Chinese (mandarin?). I wasted a lot of time trying to treat them as more standard boards. But then found two extremely helpful blog posts by Claus : Using ESP8266 Shield ESP-12E (elecshop.ml) by WangTongze with an Arduino Uno and Arduino ESP8266 WiFi Shield (elecshop.ml) by WangTongze Comparison.

The first of these posts describes a nifty little setup, using an Arduino board as a converter from USB to TTL level RS232 that the Shiald can understand (I didn’t think to order such an adapter). It looks like this:

arduino1

By default the Shiald plugs its serial TX/RX pins to the Arduino’s, which does seem a design flaw. But this can (apparently) be flipped to using software serial via regular digital I/O pins on the Uno. A key thing needed is to tell the Shiald to use 9600 baud rather than its default 115200. The setup above allows this. This part worked for me.

However, at this point, after bending the TX/RX pins out of the way on the Shiald and plugging it in on top of the Uno (with jumpers to GPIO for TX/RX), I couldn’t talk to it. So going back to Claus’s post, he suggests updating the Shiald’s firmware. Following his links, I tried a couple, ended up with the setup spewing gibberish (at any baud rate).

At this point – after a good few hours yesterday, I was ready to cut my losses with the WiFi Shialds. I’d mentioned to danbri that I was struggling with these cards and he mentioned that he’d had the recommendation (from Libby) of Wemos cards. So I started having a look around at what they were. As it happens, they have a page on their wiki Tutorial – Returning a Wemos D1 Mini to Factory Firmware (AT). The D1 uses the same ESP8266 chips as my Shiald, so this morning, nothing to lose, adjusted the script and gave it a shot. Going back to the setup in the pic (with DIP switches tweaked as Claus suggests) it worked! (Tip – along the way of flashing, I had to press the Shiald’s reset button a couple of times).

arduino-at

So far so pleasing – I thought I might have bricked the board.

(See also ESP8266 Wifi With Arduino Uno and Nano)

After this I’d tried with the Shiald mounted on top of the Arduino in a good few configurations with various different software utilities, haven’t yet got everything talking to everything else, but this does feel like progress.

Issues Raised and a Cunning Plan

Sooo… these Shialds have been rather thieves of time, but it’s all learning, innit.

These bits of play have forced me into reading up on the Arduinos a bit more. For this project, a key factor is the ADC sample rate. It seems that the maximum achievable for a single ADC is around 9kHz (with 10 bit precision). That should be plenty for the seismic sensor. The radio sensor is another matter. I’d like to be able to cover up to say 20kHz, which means a sampling rate of at least 40kHz. I’m still thinking about this one, but one option would be to use an ADC shield – these ones from Mayhew Labs look plenty – though getting the fast data along to WiFi could well be an issue (intermediate baud rates). If necessary, some local processing could be a workaround. I have been intending to present the radio data to the neural network(s) as spectrograms so maybe eg. running an FFT on the Arduino may be feasible.

Along similar lines, I may have a Cunning Plan, that is to shift some of the processing from digital to analog. This is likely to need a fair amount of research & experimentation, but the practical circuitry could be very straightforward. It seems at least plausible that the earthquake precursors are going to occur largely in particular frequency regions. The Arduino has 6 analog inputs. So imagine the radio receiver being followed by 6 bandpass filters, each tuned around where precursors may be expected. A simple diode & (leaky) capacitor peak level detector for each of these could provide a very crude spectrogram, at a rate the Arduino could easily handle. Op amp BP filters are straightforward and cheap, so an extra $5 on the analog side might save $40 and a oad more work afterward.

Regarding the research – a key source is (of course) Renato Romero’s vlf.it, notably the OPERA project – although that does seem to focus at the low end of potential frequencies.

Preconditioning Seismic Data

The filtered data I have is CSV with lots of lines with the fields :

datetime, latitude, longitude, depth, magnitude

The latter 4 fields will slot in as they are, but a characteristic of seismic events is that they can occur at any time. Say today 4 events were detected at the following times:

E1 01:15:07 lat1 long1 d1 2.2
E2 01:18:06 lat2 long2 d2 3.1
E3 01:20:05 lat3 long3 d3 2.1
E4 08:15:04 lat4 long4 d4 3.5

To get the data in a shape that can act as input to a neural network (my first candidate is PredNet), it seems like there are two main options:

Time Windows

Say we decide on a 6 hour window starting at 00:00. Then E1, E2, E3 will fall in one window, E4 the next.  Which leads to the question of how to aggregate the first 3 events. Often events are geographically clustered, a large event will be associated with nearby foreshocks and aftershocks. For a first stab at this, it doesn’t seem unreasonable to assume such clustering will be the typical case. With this assumption, the data collapses down to :

[00:00-06:00] E2 lat2 long2 d2 3.1
[06:00-12:00] E4 lat4 long4 d4 3.5

This is lossy, so if say E1 and E2 were in totally different locations, the potentially useful information of E1 would be lost. A more sophisticated strategy would be to look for local clustering – not difficult in itself (check Euclidian distances), but then the question would be how to squeeze several event clusters into one time slot. As it stands it’s a simple strategy, and worth a try I reckon.

Time Differences

This strategy would involve a little transformation, like so:

E1[datetime]-E0[datetime] = ? lat1 long1 d1 2.2
E2[datetime]-E1[datetime] = 00:03:01 lat2 long2 d2 3.1
E3[datetime]-E2[datetime] = 00:02:01 lat3 long3 d3 2.1
E4[datetime]-E3[datetime] = 07:05:01 lat4 long4 d4 3.5

Now I must confess I really don’t know how much sense this makes, but it is capturing all the information, so it might just work. Again, it’s pretty simple and also worth a try.

I’d very much welcome comments and suggestions on this – do these strategies make sense? Are there any others that might be worth a try?


Seismic Data – fixed?

As described in my last post, I was seeing significant gaps in the seismic event data I was retrieving from the INGV service. So I re-read their docs. Silly me, I’d missed the option to include query arguments restricting the geo area of the events (I had code in a subsequent script doing this).

While tweaking the code to cover these parameters I also spotted a really clumsy mistake. I had a function doing more or less this –

for each event element in XML DOM:
        extract event data
        add event data to list
        return list

D’oh! Should have been –

for each event element in XML DOM:
        extract event data
        add event data to list
return list

I’ve also improved error handling considerably, discriminating between genuine HTTP errors and HTTP 204 No Content. Now I’ve narrowed the geo area and reduced the time window for each GET down to 1 hour, there are quite a lot of 204s.

I’m now running it over the time period around the l’Aquila quakes as a sanity check. Jeez, 20+ events in some hours, 10+ in most.

Assuming this works ok, I’ll run it over the whole 1997-2017 preiod, hopefully in ~12 hours time I’ll have some usable data.

PS. Looking good, for the 30 days following that of the l’Aquila big one, it produced:

in_zone_count = 8877
max_depth = 62800.0
max_magnitude = 6.1


Seismic Data Wrangling

Following my interim plan of proceeding software-only (until I’ve the funds to get back to playing with hardware), I’ve been looking at getting seismic event data from the INGV Web Service into a Keras/Tensorflow implementation of PredNet.

My code is on GitHub, and rather than linking to individual files which I may rename, I’ll put a README over there with pointers.

As a first step, I put together code to pull of the data and dump it down to simple CSV files. This appeared to be working. The demo implementation of PredNet takes HDF5 data from the KITTI  vision dataset (videos from a car on road around Karlsruhe), extracting it into numpy arrays, with the PredNet engine using Keras. To keep things simple I wanted to follow the same approach. I’m totally new to HDF5 so pinged Bill Lotter of the PredNet project for clues. He kindly gave me some helpful tips, and concurred with what I’d been thinking – keep the CSV data, process that into something PredNet can consume.

The data offered by the Web Service is good XML delivered over HTTP (props to INGV). But it does include a lot of material (provenance, measurement accuracy etc) that isn’t needed here. So my service-to-CSV code parses out just the relevant parts, producing a line for each event:

datetime, latitude, longitude, depth, magnitude

e.g.

2007-01-02T05:28:38.870000, 43.612, 12.493, 7700, 1.7

I couldn’t find the info anywhere, but it appears that the INGV service records go back at least to somewhere in the early 1990’s, so I chose 1997-01-01T00:00:00 as a convenient start datetime, giving me 20 years of events.

For this to be a similar shape to what PredNet expects, I will aggregate events within a particular time period (actually I think taking the most significant event in that period). I reckon 6 hour periods should be about right. This also seemed a reasonable window for calling the service (not). I’ll filter down the events to just those within the region of interest (northern Italy, see earlier post)  and then scale the latitude & longitude to an easy integer range (probably [128, 128]). For a first pass I’ll ignore the depth field.

As it happens, I’m well on the way to having implemented this. But along the way I did a few sanity checks, eg. checking for maximum event magnitude in the region of interest, (I got 4.1), and it turned out I was missing some rather significant data points.  Here’s one I checked for:

The 2009 L’Aquila earthquake occurred in the region of Abruzzo, in central Italy. The main shock occurred at 03:32 CEST (01:32 UTC) on 6 April 2009, and was rated 5.8 or 5.9 on the Richter magnitude scale and 6.3 on the moment magnitude scale; its epicentre was near L’Aquila, the capital of Abruzzo, which together with surrounding villages suffered most damage.

Nope, it wasn’t in the CSV, but the Web Service knows all about it:

http://webservices.ingv.it/fdsnws/event/1/query?eventId=1895389

Doing a service call for that whole day:

http://webservices.ingv.it/fdsnws/event/1/query?starttime=2009-04-06T00:00:00&endtime=2009-04-06T23:59:59

–  yields 877 events – nightmare day!

I’d set the timeout on the HTTP calls to 2 seconds, but there is so much data associated with each event that this was woefully inadequate. Since upped to 5 mins.

Manually checking calls, I was also sometimes getting a HTTP Status Code of 413 Request Entity Too Large. This puzzled me mightily – still does actually. It says request entity, not requested (or response) entity, but the way it’s behaving is that the response requested is too large. Either way I reckon the spec (latest is RFC7231) is a little open to misinterpretation here. (What the heck – I’ve mailed the IEFT HTTP list about it – heh, well well, I’ve co-chaired something with the chair…).

Anyhow, I’ve also tweaked the code to make calls over just 1 hour windows, hopefully it’ll now get the stuff it was missing.

Hmm…I’ve got it running now and it’s giving errors throughout the year 2000, which should be trouble-free. I think I’ll have to have it make several passes/retries to ensure I get the maximum data available.

Drat! It’s giving me Entity Too Large with just 1 hour windows, e.g.

http://webservices.ingv.it/fdsnws/event/1/query?starttime=2000-12-13T01:00:00&endtime=2000-12-13T02:00:00

I need to fix this…


Candidate Neural Network Architecture : PredNet

While I sketched out a provisional idea of how I reckoned the network could look, I’m doing what I can to avoid reinventing the wheel. As it happens there’s a Deep Learning problem with implemented solutions that I believe is close enough to the earthquake prediction problem to make a good starting point : predicting the next frame(s) in a video. You train the network on a load of sample video data, then at runtime give it a short sequence and let it figure out what happens next.

This may seem a bit random, but I think I have good justification. The kind of videos people have been working with are things like human movement or motion of a car. (Well, I’ve seen one notable, fun, exception : Adversarial Video Generation is applied to the activities of Mrs. Pac-Man). In other words, a projection of objects obeying what is essentially Newtonian physics. Presumably seismic events follow the same kind of model. As mention in my last post, I’m currently planning on using online data that places seismic events on a map – providing the following: event time, latitude, longitude, depth and magnitude. The video prediction nets generally operate over time on x, y with R, G, B for colour. Quite a similar shape of data.

So I had a little trawl of what was out there.  There are a surprisingly wide variety of strategies, but one in particular caught my eye : PredNet. This is described in the paper Deep Predictive Coding Networks for Video Prediction and Unsupervised Learning (William Lotter, Gabriel Kreiman & David Cox from Harvard) and has supporting code etc. on GitHub. Several things about it appealed to me. It’s quite an elegant conceptual structure, which translates in practice into a mix of convnets/RNNs, not too far from what I anticipated needing for this application. This (from the paper) might give you an idea:

prednet-block

Another plus from my point of view was that the demo code is written using Keras on Tensorflow, exactly what I was intending to use.

Yesterday I had a go at getting it running.  Right away I hit a snag: I’ve got this laptop set up for Tensorflow etc. on Python 3, but the code uses hickle.py, which uses Python 2. I didn’t want to risk messing up my current setup (took ages to get working) so had a go at setting up a Docker container – Tensorflow has an image. Day-long story short, something wasn’t quite right. I suspect the issues I had related to nvidia-docker, needed to run on GPUs.

Earlier today I decided to have a look at what would be needed to get the PredNet code Python3-friendly. Running kitti-train.py (Kitti is the demo data set) led straight to an error in hickle.py. Nothing to lose, had a look. “Hickle is a HDF5 based clone of Pickle, with a twist. Instead of serializing to a pickle file, Hickle dumps to a HDF5 file.“. There is a note saying there’s Python3 support in progress, but the cause of the error turned out to be –

if isinstance(f, file):

file isn’t a thing in Python3. But kitti-train.py was only passing a filename to this, via data-utils.py, so I just commented out the lines associated with the isinstance. (I guess I should fix it properly, feed back to Hickle’s developer.)

It worked! Well, at least for kitti-train.py. I’ve got it running in the background as I type. This laptop only has a very wimpy GPU (GeForce 920M) and it took a couple of tweaks to prevent near-immediate out of memory errors:

export TF_CUDNN_WORKSPACE_LIMIT_IN_MB=100

kitty_train.py, line 35
batch_size = 2 #was 4

It’s taken about an hour to get to epoch 2/150, but I did renice Python way down so I could get on with other things.

Seismic Data

I’ve also spent a couple of hours on the (seismic) data-collecting code. I’d foolishly started coding around this using Javascript/node, simply because it was the last language I’d done anything similar with. I’ve got very close to having it gather & filter blocks of from the INGV service and dump to (csv) file. But I reckon I’ll just ditch that and recode it in Python, so I can dump to HDF5 directly – it does seem a popular format around the Deep Learning community.

Radio Data

Yes, that to think about too.

My gut feeling is that applying Deep Learning to the seismic data alone is likely to be somewhat useful for predictions. From what I’ve read, the current approaches being taken (in Italy at least) are effectively along these lines, leaning towards traditional statistical techniques. No doubt some folks are applying Deep Learning to the problem. But I’m hoping that bringing in radio precursors will make a major difference in prediction accuracy.

So far I have in mind generating spectrograms from the VLF/ELF signals. Which gives a series of images…sound familiar? However, I suspect that there won’t be quantitatively all that much information coming from this source (though qualitatively, I’m assuming vital).  As a provisional plan I’m thinking of pushing it through a few convnet/pooling layers to get the dimensionality way down, then adding that data as another input to the  PredNet.

Epoch 3/150 – woo-hoo!

PS.

It was taking way too long for my patience, so I changed the parameters a bit more:

nb_epoch = 50 # was 150
batch_size = 2 # was 4
samples_per_epoch = 250 # was 500
N_seq_val = 100 # number of sequences to use for validation

It took ~20 hours to train. For kitti_evaluate.py, it has produced some results, but also exited with an error code. Am a bit too tired to look into it now, but am very pleased to get a bunch of these:


New Strategy for Seismic Data

I’m a massive procrastinator and not a very quick thinker. There is something positive about all this. I’ve barely looked at code in the past few weeks, but have been thinking about it, and may well have saved some time. (I usually get there in the end…).

The neural net setup I had in mind was based on the assumption that I’d have my own, local, data sources (sensors). But hardware is still on hold until I find some funds. So I’ve been re-evaluating how best to use existing online data.

Now I am pleased with the idea of taking the VLF radio data as spectrograms and treating them (conceptually) as images, so I can exploit existing Deep Learning setups. If I’m not getting the seismic data as time series from a local sensor(s) but from INGV, I can use the same trick. They have a nice straightforward Web Service offering Open Data as QuakeML (XML) over HTTP from URL queries. They also render it like this:

seismo-map

So I’m thinking of taking the magnitude & depth data from the web service and placing it in a grid (say 256×256) derived from the geo coordinates. To handle the time aspect, for each cell in the grid I reckon picking the max magnitude event over each 6 (?) hour window. And then (conceptually) treating this as a pixel map. I need to read up a little more, but this looks again like something that might well yield to convnets, constructed very like the radio data input.

PS.

I made a little start on coding this up. First thing was to decide what area I wanted to monitor. Key considerations were: it must include here (self-preservation!); it must cover a fair distance around the VLF data monitoring station who’s data I’m going to use (Renato Romero’s, here); it should include the main seismically active regions likely to impact those two places.

You can get an idea of the active regions from the map above, here’s another one showing estimated risk:

hotspots

In one of the papers I’ve read that the radio precursors are only really significant for a 100km or so (to be confirmed), so I’ve chosen the area between the 4 outer markers here:

area

This corresponds to latitude 40N-47N, longitude 7E-15E.

The marker middle-left is the VLF station, the one in the middle is where I live.

It looked like the kind of thing where I could easily get my lats & longs mixed up so I coded up the little map using Google Maps, was very easy, source – rendered it on JSFiddle.

Next I need to get the code together to make the services requests, filter & aggregate the seismic event data is some convenient for ready for network training.